The Veeam Community Weekly Recap is available with incredible content and relevant information! Congratulations to Nico Losschaert, Brad Linch, Christian Eromosele, and Philippe Dupuis for the posts and articles.
Thanks so much to Madalina Cristil, Mark Boothman, and Safiya Mohamed for the opportunity to participate! I am honored.
According to the “State of Kubernetes 2023” survey. 84% of the companies prefer to let vendors handle assembling and keeping Kubernetes up to date.
There are over 100 Kubernetes distributions on the market, including xKS services and Kubernetes orchestration software.
At least 20+ individual services must be associated with a K8s distribution for it to be used as a trustworthy platform. So, building a K8s platform from scratch is not a business focus – as demonstrated in this survey. Article by Michael Coté
Many users are deploying the famous Scale-Out Backup Repository architecture in a multi-tier environment, including the native integration with cloud provider services like Azure Blob.
Before VBR v12, the Azure Storage services were non-immutable – considering the context of the Veeam VBR. Some users already have Azure Blobs extends allocated in their SOBR´s Capacity Tier. Now, these non-immutable extents are populated with many backup files.
After Azure implemented object-level locking, the VBR v12 incorporated it as an immutable backup repository option. And now, the users want to migrate these backup files to Azure Blobs with immutability enabled to get better protection against Ransomware or strengthen their Business Continuity strategies.
So, why not enable the immutability flag in an existent Azure Blob service?
Unfortunately, it is not supported, despite Azure´s procedure for “Migrate an existing container to support version-level immutability.”
There is a Veeam´s KB number 4416 for “How to Configure Azure Storage Account to Leverage Immutability with Veeam Backup & Replication.” This document has an explicit orientation:
Immutability can only be used with new storage account containers and cannot be used with existing backup data where immutability was not applied previously.
Therefore, you must deploy a new object storage repository with immutability.
And is it possible to add a new immutable Azure Blob object storage as an additional extent into a Capacity Tier with native non-immutable object storage extents?
The answer is no.
There is another Veeam recommendation related to the extent of a Capacity tier:
Capacity tier extents must have the same immutability state. If you use immutability, you must enable it for all capacity extents. If you do not plan to use immutability, do not enable it for any capacity extent.
Therefore, to migrate from a non-immutable bucket to an immutable bucket into the Capacity Tier, it is necessary to offload the backup files from the Capacity Tier extents to the Performance Tier extents.
The procedure is as follows:
Download all backup files from the non-immutable object storage repository to the Performance Tier.
Add a new object storage repository to the Veeam Backup & Replication environment.
Replace the non-immutable object storage repository with the new immutable object storage created in the last step.
Manually move the backup files from the Performance Tier to the new immutable Azure Blob object storage repository.
The new Veeam backup for office 365 is available with important capabilities and features:
IMMUTABILITY
With v7 you can leverage backup copies with enabled immutability to get peace of mind that Microsoft 365 data is out of reach from ransomware attacks and can be recovered with confidence.
Veeam Backup for Microsoft 365 supports Azure Blob Storage Archive access tier, Amazon S3 Glacier Instant Retrieval, Amazon S3 Glacier Flexible Retrieval and Amazon S3 Glacier Deep Archive storage classes only as a target for backup copy jobs.
It also includes many retention setups like immutability period / retention period, Blob object continues until all items out of retention, next backup copy becomes immutable and new data put to new Blob objects.
MONITORING AND REPORTING – INTEGRATION WITH VEEAM ONE
Advanced monitoring and reporting is delivered through upcoming Veeam ONE v12. This integration allows you to proactively monitor Microsoft 365 backup and storage resources with an at-a-glance dashboard, receive alerts to resolve issues immediately and leverage SLA reports to ensure you can meet recovery points objectives and stay in compliance.
Veeam ONE comes at no additional cost to customers of Veeam Backup for Microsoft 365
ENHANCEMENTS SELF-SERVICE RESTORE PORTAL
Self-Service Restore Portal now has support for Microsoft Teams, in addition to the services it already supports including Exchange Online, SharePoint Online and OneDrive for Business. Users can now choose individual restore points as needed and restore SharePoint Online and OneDrive for Business folders.
DEEPER INTEGRATION WITH VEEAM SERVICE PROVIDER CONSOLE
Building upon existing features, the Veeam Service Provider Console allows organizations to have increased control for leveraging BaaS for Microsoft 365 backups with a Veeam Cloud and Service Provider partner. Tenants will gain the autonomy to create backups, monitor protected data and recover at any time without service provider assistance. They can also take advantage of easier adoption with secure onboarding, automated billing and REST API support.
Hi! I will show the steps to deploy and access Kasten K10 on a Red Hat OpenShift cluster.
Premises: there is a pre-implemented Red Hat OpenShift cluster for this lab with 03 master nodes and 03 worker nodes. The cluster access is granted through SSH access from the bastion server or the OpenShift console.
We can get detailed information about the nodes using this command:
oc get nodes
To use OpenShift and K10 with CSI-based volume snapshots, the VolumeSnapshotDataSource feature flag needs to be enabled.
From the OpenShift management console, select Administration → Cluster Settings → Global Configuration → Feature Gate → YAML.
Edit the file with the following complement. After that, click in “Save” and “Reload”:
There are two methods to install K10 on Red Hat OpenShift: Helm-based and Operator-based. For this deployment, we will use Helm-based installation.
The first step is to install Helm. As we know, Helm is a software package manager that simplifies the deployment of applications and services, including OpenShift Container Platform clusters. The OC 4.10 documentation describes the steps for Helm installation:
It creates the correct security context against the users created by the installation. It is needed in OpenShift as the security context stance is higher OOTB than that of a vanilla Kubernetes install.
–set route.enabled=true
It creates a route in OpenShift using the default ingress, so the Kasten dashboard is accessible externally. It will use the default cluster ID domain name.
–set route.path=”/k10″
It sets the route path for the redirection of the dashboard. We will use this route to access the K10 dashboard from OpenShift console.
–set auth.tokenAuth.enabled=true
This sets the type of authentication of the Kasten Dashboard, as we will see next.
Now, it is necessary verify the K10´s Pods deployment.
kubectl get pods -n kasten-io -w
It takes a few minutes for all K10 pods to be deployed, running, and ready.
Check the route information:
$ oc get route -n kasten-io
oc describe route k10-route -n kasten-io
We can see it highlighted the FQDN of the Kasten instance that we would use to access the Kasten Dashboard from the Openshift console. For this lab, default user “k10-k10” will be used, which has full administrator privileges:
sa_secret=$(kubectl get serviceaccount k10-k10 -o jsonpath="{.secrets[0].name}" --namespace kasten-io)
kubectl get secret $sa_secret --namespace kasten-io -ojsonpath="{.data.token}{'\n'}" | base64 --decode
Now it is necessary to provide “port forward” to access the K10 dashboard. For this, we can open a new terminal and execute this command:
Usually, the Kasten panel is available at: http://127.0.0.1:8080/k10/#/. However, in this lab, we only have SSH access via bastion. The simplest and most direct way is to access the dashboard from the OpenShift console.
In admin view, select Home>Project:
Select the kasten-io project and in the overview tab, click on Route:
Click on the displayed URL:
A new tab will open in the browser with the Kasten dashboard. Copy and paste the token to get access.
Now, K10 can be configured with the desired Locations profiles, and storage services. The storage classes can be changed and adjusted according to the environment’s needs. After that, configure the desired policies and associate them with the desired application namespace.
Script for automatic deployment
If you do not want to perform each of these steps manually, you can use the a bash available on my Git Repository:
Alongside the general availability of the Ansible Automation Platform 2.3, Red Hat announced the Event Driven technology, a community project released by Red Hat.
Event-Driven Ansible, is now available as a developer preview.
Red Hat also announced plans to integrate Event-Driven Ansible into AAP (Ansible Automation Platform) as an integrated component in 2023. For more information on why event-driven automation matters for IT Teams, refer to:
Process events from external sources, like tools from partners.
Determine the desired response to the event.
Execute automated actions to address or remediate the event.
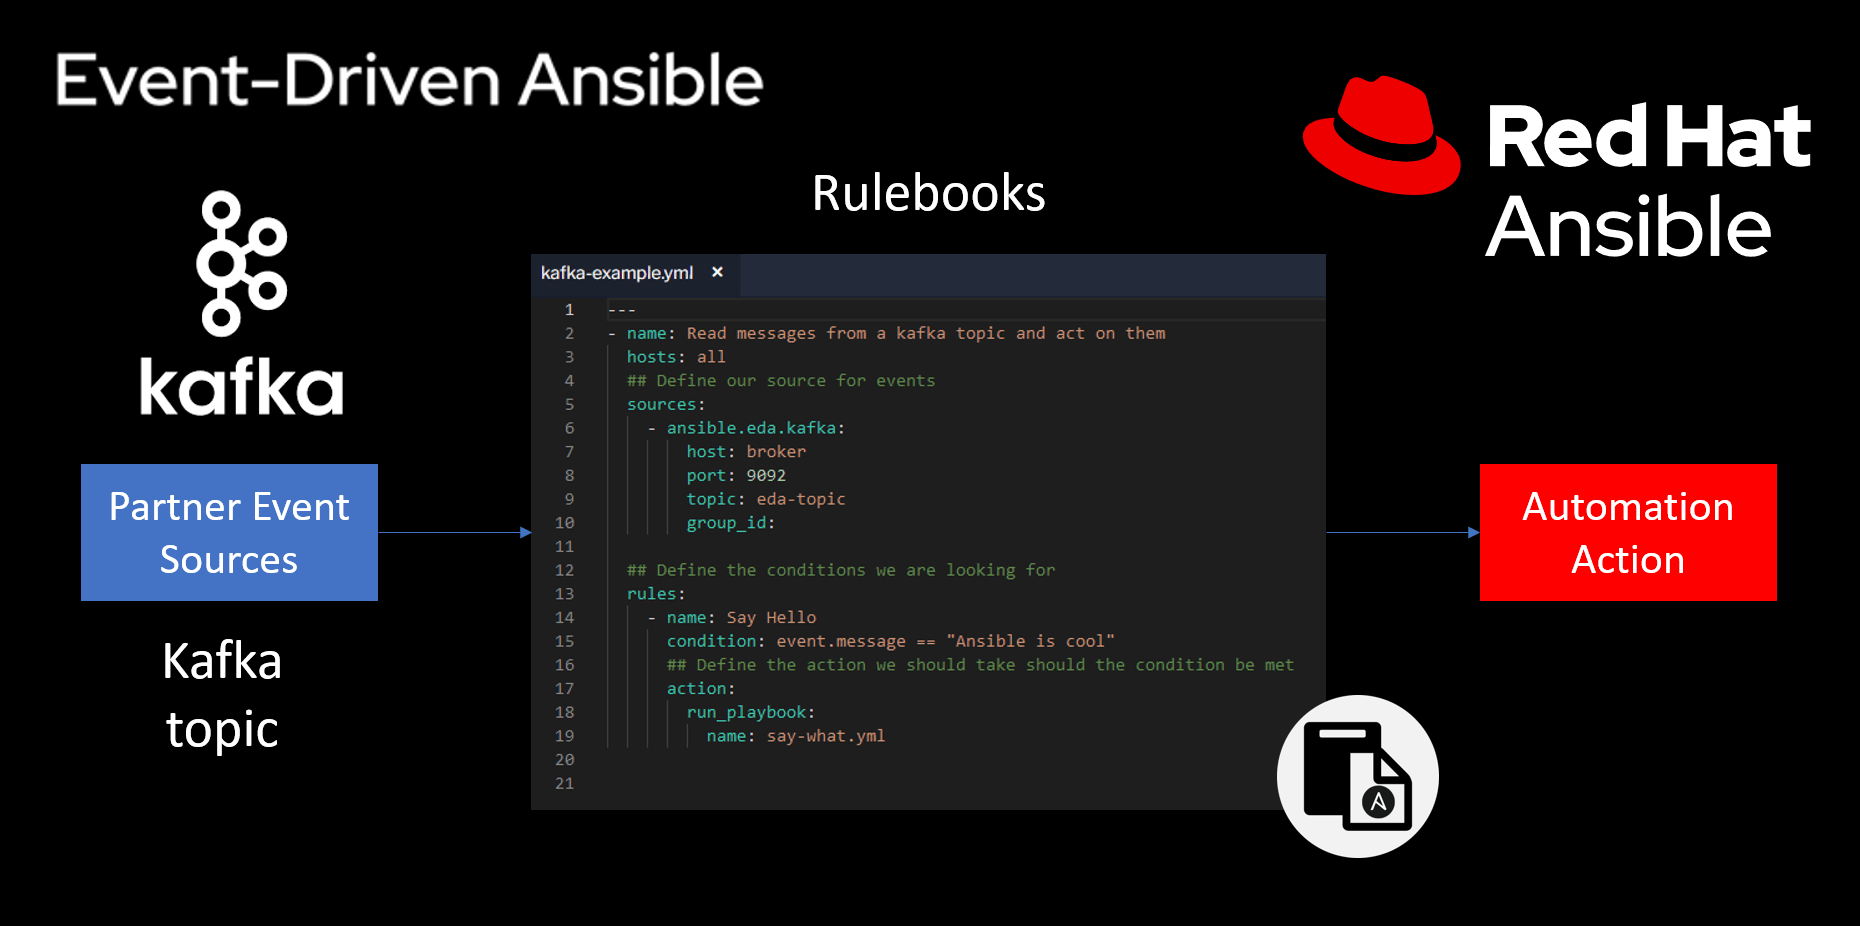
Event-Driven connects sources of events with desired actions using rulebooks.
Rulebooks define the event source and determine the action to take when a specific condition is detected. The detection is defined with a familiar “if-this-then-that” instruction, and the action can be like running a playbook or directly executing a module.
Like traditional Ansible Playbooks, rulebooks are also created in YAML.
The three main components of the rulebooks are:
Source: the sources of events come from source plugins. These plugins define where to listen for events.
Condition: the conditional statements in the rulebook allow matching criteria on which is necessary to have a response.
Action: The action is the response once the condition has been met from the event source as trigger remediation, log a ticket for observation, or generate other events as the response.
In the example below, we will monitor kafka messages on a topic and respond to a specific one.
You can access and try this simple guided lab at the following link:
(this post does not use chatGPT, it was created with researching and reading only)
What happens when the Kubernetes API requests a Pod creation? In this post, I highlight the components and tasks involved in this process, summarizing their functions and actions.
But first, let’s remember some basic concepts about Kubernetes.
A Kubernetes cluster consists of worker machines called nodes that run our containerized applications. Every Kubernetes cluster has at least one worker node. But a cluster usually runs multiple nodes, providing fault tolerance and high availability.
Kubernetes nodes host the pods. A Pod is a group of one or more connected containers. And those containers share resources like storage, networking, and a specification of how they should run. So, in a generic analogy, a pod is an element that performs the function of a “logical host”.
We know that the Kubernetes control plane manages the nodes and pods in the cluster. And we also know that in production environments, the control plane usually runs on at least three nodes to ensure high availability.
The core of the Kubernetes control plane component is the API server.
This server exposes an HTTP API that allows users, using a command-line tool called kubectl, to perform various container management and orchestration tasks, such as: creating, updating, modifying, or deleting a resource, deploying applications, performing updates, and accessing logs.
In addition to the command line interface, you can use GUI dashboards from Kubernetes Orchestrators tools. And it is also possible to access the APIs directly through REST calls from an application, for example.
Creating a Pod involves several steps. Everything starts on the control plane.
1 – Using the kubectl and performing the “kubectl run” command, a user requests the API server to create a new Pod in the cluster. The first operation is the API server authenticates and validates the user credentials.
2 – The API server writes the configuration to the etcd, a distributed key-value data store. It is the source of trust for the cluster and ensures that its state remains consistent.
The etcd confirms to the API server that it has made a successful write for this request.
3 – The API server returns to the kubectl that the Pod was created! This fast answer is possible because the etcd already defined a desired state of the cluster. From now, the Kubernetes components will work together to make this desired state equal to the actual state of the cluster.
So, until now, we have the new Pod recorded in the desired state for this cluster.
4 – The scheduler keeps an eye on the workloads that need to be created. It also determines which node will place a workload. What it is doing, in a nutshell, is pinging the API server at regular intervals and checking if any workloads need to be scheduled.
At this moment, the API server informs that a new Pod needs to get created in one of the nodes. The scheduler looks at the available nodes. It will rule out any unsatisfactory nodes due to resource limitations.
Finally, the scheduler chooses the best node to run the workload by considering all the factors.
5 – Once the scheduler chooses a node, it sends the information to the API server where the POD creation must be performed.
6 – The API server updates the desired configuration in the etcd. After the successful write in the etcd, there is information about the desired state versus the actual state. With this information, the API server knows what it needs to do to make the actual state meet the desired state.
The etcd confirms to the API server that it has made a successful write for this request.
7 – The API server then sends API instructions to a node component called the kubelet.
The kubelet is an agent that runs on each Kubernetes node and is responsible for functions like registering the node with the cluster and sending periodic health checks to the API server. It also creates and destroys workloads as directed by the API server. As a security function, Kubernetes supports SSH tunnels to secure the control plane for node communication paths.
So, abstracting the details of these APIs calls, the API server sends an API message to the kubelet like this: create this Pod using node x.
Breakpoint: CRI and OCI
At this point, we have a community-defined communication layer called the Kubernetes Container Runtime Interface, or CRI.
Since the beginning of container technology, several types of runtime containers have been created.
So, CRI defines gRPC APIs that allow the kubelet to interact with various runtime containers without recompiling the cluster components. CRI makes it possible to perform an abstraction for different types of runtime containers, such as Docker, containerd, or CRI-O.
On the other hand, we know that container runtime is the software component responsible for managing the lifecycle of the containers.
It is in charge of defining and creating the isolated environments in which the containers are executed, providing the necessary resources and interfaces for the functioning of the containers, and interacting directly with the functions of the Linux Kernel.
And the OCI Runtime Specification is one of the thee specifications defined by the Open Container Initiative (OCI). It describes the requirements for the runtime environment, the interfaces for containers, and the minimum set of functionalities that container runtimes must provide to be considered OCI compliant.
This specification allows for the creation and management of containers using a standard set of tools and APIs, regardless of the underlying platform. OCI enables interoperability and portability between Docker and Kubernetes, for example.
The OCI Runtime Specification defines a minimum of five standard operations: create, start, state, delete and kill.
It is possible to highlight CRI-O, containerd, and runc as examples of OCI-compatible runtimes and some of the most popular runtimes on the market.
Container runtimes are divided into three main categories:
High-Level container runtimes like CRI-O and containerd.
Low-Level container runtimes like runc and crun.
Sandboxed and virtual container runtimes like gVisor, Firecracker, runV, and kata-containers.
In this example, we are using CRI-O and runc runtimes.
About CRI-O
CRI-O implements the Kubernetes Container Runtime Interface (CRI) and enables Open Container Initiative (OCI) compatible runtimes.
It is a graduated project of the Cloud Native Computing Foundation (CNCF) and is maintained by Red Hat, Intel, Suse, Hyper, and IBM. It is a lightweight alternative to using Docker as a runtime. CRI-O is the default runtime for Red Hat OpenShift and Suse Rancher.
CRIO-O allows running containers in read-only mode. Thus, an attack surface is removed, blocking the actions of intruders in addition to preventing data loss.
The container bundle
There are two most essential components for the creation of a container:
config.json file.
container root directory.
The config.json file has the complete layout for the container lifecycle, from container start to deletion. It holds all the metadata for creating the container, like the OCI version, the path for the container root directory, the namespace, resource limit definitions for the container process, user-defined processes, and others metadata.
The container root directory is the topmost directory of a container file system. It is the starting point for a file system tree, which contains all other directories and files in the container.
Back to the Pod creation flow
Next steps for creating the Pod:
8 – The kubelet forwards the request to the CRI-O using the CRI gRPC interface.
9 – The container root file directory is created.
10 – CRI-O uses the containers/image library to pull the image from a container registry.
11 – The downloaded image is unpacked into the container root filesystem and stored in the containers/storage library. The container image is created.
12 – CRI-O then generates the container OCI runtime specification, a config.json.
13 – CRI-O then launches the runc runtime to start the container creation process.
About runc
The runc container runtime serves as the low-level container runtime and has become a de facto standard in the market.
It is a lightweight and portable implementation of the Open Container Initiative (OCI) container runtime specification. It is also Cloud Native Computing Foundation (CNCF) compliant.
It is implemented using the Go programming language and shares a lot of low-level code with Docker. It provides full support for Linux security features such as Namespaces, SELinux, c-groups, Seccomp, live migration, portable profiles, native DPDK support, and other functions
The features of the Linux kernel:
In Linux, every process has a unique identifier represented by, called the process ID (PID).
A container is just a Linux process. More precisely, it is a forked or cloned process with a dedicated PID.
A container is also an isolated process.
To isolate a container from the other processes, Linux uses some of its native Kernel features.
A Namespace isolates specific system resources that are generally visible to all processes. Within a Namespace, only processes that are members of that namespace can see those resources.
Another Linux function associated with containers is c-groups (Control Groups). It is a Linux kernel feature that limits, accounts for, and isolates resource usage (CPU, memory, I/O bandwidth, and others.) for the processes. It prevents a process from using too many resources on the host.
Seccomp (Secure Computing Mode) is a feature that limits how processes can use system calls. Seccomp allows a process to define a filter for incoming system calls. The filter specifies which system calls are allowed and which are denied, providing a way to restrict the scope of what a process can do. It helps to prevent malicious code from executing certain types of attacks, such as privilege escalation.
Security-Enhanced Linux (SELinux) is a mandatory access control system for processes. Linux kernel uses SELinux to protect processes from each other and to protect the host system from its running processes. It defines rules for how subjects (processes, applications, users) can access objects (files, directories, devices).
So, containers are just processes that use those Linux kernel features to create an isolated environment from the host operating system and other running processes.
Back to the Pod creation flow
The subsequent steps for creating the Pod are:
14 – The runc receives the OCI runtime specification and interacts with the Linux Kernel to deploy the container.
15 – The runtime asks Linux for a clone or fork system call. The clone system call is used to create a new process with a specific namespace, and c-groups limit the resources available to the container. In this way, the clone system call plays a critical role in the implementation of containers in Linux, allowing for the creation of isolated and resource-controlled environments for applications and services
16 – Using the Linux Kernel features described before the container is created. This summary does not intend to detail all internal processes in the kernel
17 – As kubelet is a controller that watches for Pod changes, it will collect the information that the POD was created
18 – The Pod is registered with the API Server by the kubelet.
19 – The Pod creation is written in the etcd.
The scheduler checks whether the desired state matches the actual state on subsequent pings.
No other tasks should be performed. The user request is concluded.
It is all for this moment. I hope this information can be helpful; I will come back with more Kubernetes information in the following posts.
Hi! This figure represents my interpretation of the VMware portfolio for the current quarter (FY23Q4 – from 10/29/22 to 02/03/23).
It is divided into nine major categories, with each main product related to them. The primary inclusions/alterations in this quarter are Aria, Contexa, vSphere+, and vSAN+.
These products unfold into bundles and suites and can be associated with other products, such as add-ons or standby products, to deliver specific solutions. Therefore, not all VMware products and add-ons are represented in this figure. It only means the main product lines.
For sample:
The product is Tanzu:
It is divided into four bundles:
Tanzu Kubernetes Grid;
Tanzu Standard;
Tanzu Kubernetes for Operations;
Tanzu Applications Platform.
A possible related product or add-on is VMware Data Solutions, which includes: VMware Tanzu RabbitMQ for VMs, VMware Tanzu RabbitMQ for Kubernetes, VMware Tanzu GemFire, and VMware Tanzu SQL.
The product is Aria Operations:
A related product is VMware Aria Operations for Networks (former vRealize Network Insight). Another related product is VMware Aria Operations for Applications (former Tanzu Observability)
The product is NSX:
NSX is divided into five bundles:
NSX-T Professional;
NSX-T Advanced;
NSX-T Advanced Limited Edition;
NSX-T Enterprise Plus;
NSX-T for Remote Office Branch Office (ROBO).
A possible related add-on for some bundles is VMware NSX Advanced Load Balancer. Another possible corresponding add-on is VMware NSX Advanced Threat Prevention.
=====================================
Here is a brief description of some products:
VMware vSphere: a suite of software components for managing and deploying virtual machines (VMs). The vSphere components include ESXi, vCenter Server Standard, and other software components that fulfill several functions in the vSphere environment. This product is based on perpetual or defined-term (years) subscriptions.
VMware vCenter is a management tool for vSphere environments that allows administrators to manage and monitor VMs and hosts centrally.
VMware vSphere+ is a new offering consisting of both on-premises and cloud components interacting with each other. On-premises components include cloud gateways, vCenter instances, and ESXi hosts. On the other hand, cloud components include various cloud services for admins and developers. This product license is based on a subscription.
VMware NSX: a network virtualization platform that enables the creation of virtual networks within a network infrastructure, forming the foundation of the software-defined data center (SDDC). Like the operational model of VMs, networks can be provisioned and managed independently (overlay) of the underlying network configurations and components. NSX brings networking and security closer to where the application runs, such as virtual machines, containers or physical servers.
VMware vSAN: an HCI (Hyperconverged infrastructure) solution that converges compute, storage, and networking (SAN) resource on industry-standard x86 servers. VSAN is implemented directly into the VMware ESXi hypervisor at the Kernel level. It virtualizes the local physical storage resources of ESXi hosts and turns them into pools of storage that can be divided and assigned to virtual machines and applications according to their requirements.
VMware VSAN+: vSAN+ is a HCI offering that delivers cloud-connected services. Traditional vSAN Standard, Advanced, and Enterprise editions are licensed per core, per CPU (socket), VDI, or VM. vSAN Enterprise Plus edition is licensed per CPU only. But vSAN+ is only compatible with vSphere+ and is licensed by core only.
VMware Aria: it is a suite of management and automation tools for multi-cloud environments that include Aria Operations for performance and capacity management; Aria Automation for IT automation and cloud management; VMware Aria Cost for multi-cloud cost control powered by CloudHealth; and VMware Aria Operations for Logs.
VMware Contexa: it is a threat intelligence cloud. It is a service that combines previously separate threat intelligence solutions into one integrated platform. It provides visibility and control over the devices, users, and applications that access the network. It uses contextual information to create a dynamic security posture to protect against malware, phishing, and advanced persistent threats.
VMware Carbon Black is a cloud-native endpoint, workload, and container protection platform. Carbon Black is a Software as a Service, subscription-based solution that collects and sends information about devices and applications to a VMware cloud analytics platform. Where, per day, more than 1.3 trillion events sent by agents installed and spread worldwide are analyzed. In addition to the fully cloud-hosted solutions called the Carbon Black Cloud, some solutions can be deployed on-premise. Users effortlessly access Carbon Black through a standard web browser or by integration via APIs. Universal software agents are installed on protected devices.
VMware Cloud Foundation: it is a hybrid cloud platform that brings together vSphere, vSAN, NSX, and Aria to simplify the deployment and management of applications across hybrid clouds.
VMware Cloud Disaster Recovery: VMware Cloud Disaster Recovery is an on-demand disaster recovery and ransomware recovery service that provides an easy-to-use Software-as-a-Service (SaaS) solution and offers cloud economics to keep your recovery costs under control. Protecting vSphere virtual machines (VMs) by replicating them to the cloud and recovering them to a target SDDC on VMware Cloud on AWS is possible. It is also possible to use VMware Cloud DR for ransomware recovery, using a Recovery SDDC as an isolated recovery environment (IRE) where the administrator can inspect, analyze, and repair snapshots of infected VMs and restore them to a production environment.
VMware SD-WAN: like NSX, it is also a software-defined networking solution. The focus is ensuring high application performance and availability while lowering communication costs. VMware SD-WAN enables a reliable and resilient wide area network (WAN) with a choice of connection types, including Multiprotocol Label Switching (MPLS), LTE, Wi-Fi, and broadband. It combines multiple links and uses packet steering to select the best path for each application, ensuring consistent performance and overcoming quality issues and outages. Additionally, it provides unified security and network management capabilities.
=================
In the following link, you can find the current VMware Product Guide. It´s a valuable source of information to understand the bundles, suites, licensing types, and how each product is charged.
But be careful. This file version does not yet include all the changes in naming and new products previously presented.
Hi! Are you interested in metering the costs of Kubernetes environments? OpenCost is a vendor-neutral open-source and a CNCF sandbox project.
It was initially developed by Kubecost, and supports dynamic billing integration with significant cloud providers such as AWS, GCP, Azure, and on-prem clusters via custom pricing sheets.
The OpenCost UI is a graphic-friendly interface, and OpenCost can also run as a Prometheus metric exporter, allowing you to view various cost metrics directly on Prometheus. Among the founding contributors of the project, it is possible to highlight Amazon Web Services (AWS), Adobe, Google Cloud, Kubecost, Red Hat, and SUSE.
“Gravidade dos Dados é uma teoria em torno da qual os dados teriam massa. À medida que os dados se acumulam, eles começam a exercer mais força de gravidade. Esta gravidade aproxima cada vez mais os serviços e as aplicações dos dados. Essa força de atração é causada pela necessidade dos serviços e das aplicações de conseguirem menor latência e/ou maior capacidade de comunicação com os dados”.
Quanto mais os dados crescem, fica mais difícil movimentá-los. Em vez disso, as aplicações e os serviços tendem a se aproximar dos dados por meio desta força de atração, decorrente da maior massa.
A latência e o throughput agem como aceleradores para aumentar ainda mais esta força de união. Por exemplo, dentro de um datacenter, a baixa latência e alto throughput proporcionados pela rede local permitem atender a necessidade dos serviços e das aplicações de permanecerem próximos aos dados para que possam alcancar a melhor performance possível.
O crescimento dos dados em um ponto centralizado da infraestrutura limita a flexibilidade, causa aumento de custos e traz dificuldades operacionais para as empresas.
Por exemplo, a concentração de armazenamento em larga escala em zonas ou regiões específicas na nuvem pública geralmente leva a potencialização do efeito da Gravidade dos Dados e a um certo tipo de lock-in.
Os provedores oferecem incentivos para reduzir o atrito do upload de dados. Embora eles cobrem uma taxa de armazenamento mensal com base na volumetria, não há nenhum custo pelo upload de dados nestes serviços de armazenamento. A ingestão/transferência dos dados é completamente gratuita.
Por outro lado, existem custos para mover os dados para fora da nuvem, tanto num cenário de acesso remoto de usuários como num cenário de migração para a nuvem de outro provedor ou mesmo para a nuvem privada da empresa. Neste caso, além do custo de armazenamento em si, incidem custos de saída (“data transfer-out”) e de transações sobre os dados, como ações de PUT, GET , POST e COPY.
Geralmente, ocorre a cobrança de transferência de saída dos dados nos seguintes cenários – e não apenas na transferência de dados para a Internet:
Tráfego de rede de saída;
Tráfego entre zonas;
Tráfego entre regiões;
Tráfego para endereços IP públicos (para a Internet).
Quanto maior a “distância” do destino, em ordem crescente na relação anterior, provavelmente mais cara será a operação de saída dos dados. A medida utilizada é geralmente baseada na transferência de Gigabytes por mês.
Alguns exemplos de operações que incorrem nestes custos:
Transferência de dados de storage para storage;
Transferência de dados entre aplicações e bancos de dados;
Transferência de dados entre aplicações;
Transferência de dados entre aplicações e usuários, como por exemplo, a transmissão de vídeos e conteúdo.
Assim, quanto mais dados uma empresa armazenar numa determinada zona ou região de uma nuvem pública, mais caro e difícil será movê-los para outro local devido à natureza da Gravidade dos Dados, que acabará atraindo mais aplicações e serviços para a nuvem, e também aos atritos gerados pelos custos de transferência e saída dos dados.
O fenômeno da Gravidade dos Dados não pode ser eliminado, mas pode (e deve) ser contornado pelas empresas.
Algumas medidas incluem:
1) Adotar uma arquitetura de nuvem híbrida, definindo onde e como os dados serão alocados de forma menos densa. É preciso considerar fatores que incluam a localização das unidades de negócios e dos usuários finais dos dados. Além disso, as regulamentações locais acrescentam mais considerações em relação a privacidade e conformidade de dados.
2) Implementar políticas de governança e gerenciamento dos dados, englobando desde a conformidade do dado a até a exclusão / tierização / arquivamento dos dados desnecessários ou com pouca utilização.
3) Fazer uso de técnicas de replicação dos dados para as regiões onde eles serão efetivamente consumidos. Isso contribuirá para a descentralização das aplicações.
4) Migração de massas de dados para Datalakes ou DataHubs, eliminado silos.
5) Adjacência dos dados – ou adjacência de nuvem. Implementação destes Datalakes ou DataHubs em co-locations com grande capacidade de comunicação com provedores de nuvem pública e provedores de acesso. Isso permite maior portabilidade das aplicações entre provedores diferentes, mantendo os dados sob controle da empresa e minimizando tanto a latência como o lock-in, além de facilitar iniciativas de Multicloud e de Business Intelligence.
6) Adoção do Edge Computing, movendo os datasets para a borda e para mais perto das aplicações e dispositivos dos clientes.
7) Reduzir o volume dos dados que convergem da borda para o centro e ampliam o efeito da gravidade. Em vez disso, procurar utilizar análises locais e em tempo real nas bordas.
8) Fazer uso de sistemas hiperconvergentes nos pontos de concentração de dados on-premise, desde as bordas até os pontos centrais. Devem possuir capacidade para que sejam expandidos para a nuvem pública a qualquer momento e conforme a necessidade.
9) Utilizar soluções que permitam portabilidade e migração de aplicações entre diferentes tipos de infraestruturas e nuvens, especialmente entre hypervisors distintos e entre ambientes de containers.
10) Escolher, preferencialmente, soluções de armazenamento de dados abertas, convergentes e compatíveis com os principais padrões estabelecidos no mercado.
Este é um tema realmente importante e que merece atenção neste ano de 2023 tendo em vista:
· As pressões por redução de custos recorrentes (Opex) devido a diminuição projetada no ritmo de crescimento da economia norte-americana;
· A necessidade cada vez maior de estratégias de AI e ML para garantir inovação e maior competitividade aos negócios;
· O desejo latente dos clientes pela diminuição dos custos e das dificuldades de portabilidade e migração dos dados e aplicações entre diferentes provedores e infraestruturas de nuvem.
Espero que este pequeno resumo tenha ajudado! Até a próxima!