The Veeam Community Weekly Recap is available with incredible content and relevant information! Congratulations to Nico Losschaert, Brad Linch, Christian Eromosele, and Philippe Dupuis for the posts and articles.
Thanks so much to Madalina Cristil, Mark Boothman, and Safiya Mohamed for the opportunity to participate! I am honored.
Hi! Veeam released the Kasten K10 6.0.0 last week, a robust version to improve cloud-native data protection and mobility.
The main capabilities and features are:
Veeam Data Platform Integration;
Application Fingerprinting;
Multi-cluster License Management;
Transform Library;
Red Hat OpenShift Virtualization;
Deploy Kasten K10 directly from Amazon EKS Console;
Ransomware Protection integrations: Kyverno, Red Hat Advanced Cluster Security, AWS Guard Duty, Grafana, AWS Secrets Manager;
More Cloud Native Integrations: Kubernetes v1.26, Red Hat OpenShift Container Platform 4.12, Google Anthos, VMware Tanzu, Cisco Hyperflex + Red Hat OpenShift.
Below I describe some of the new capabilities:
K10 and Veeam Data Platform Integration
Kasten can be connected to Veeam Data Platform V12, allowing centralized visibility and management of Kubernetes backups in Veeam Backup & Replication V12.
As made available since the release 5.5.9, Kasten enables Instant Recovery capabilities. At this release, it is a feature that requires vSphere 7.0.3+ and a Veeam Backup server version V12. It is based on Instant First-Class Disk (FCD) Recovery feature from Veeam Backup & Replication v12. Tanzu is not supported at this moment.
In this case, a vSphere cluster is hosting the Kubernetes cluster. K10 asks the Veeam Backup server to make an Instant First Class Disk (FCD) Recovery and then creates Persistent Volumes that use those FCDs.
The vPower architecture is the same: FCDs exist in a vPower NFS datastore created by the Veeam Backup server. The application will run using these resources once the Instant Recovery has been completed.
To conclude the operation, you must migrate FCDs to the production environment or stop publishing them. Veeam Backup & Replication uses the Quick Migration mechanism to migrate the disks – with no interruption in the service.
For more information about K10 and VBR integration, refer to the following user guide:
For those familiar with Veeam Backup & Replication, it is a capability like the VBR´s Enterprise Manager, allowing unified management of licensing across multiple clusters.
Using a single license, K10 multi-cluster manager enables licensing all clusters in the same multi-cluster system. It is achieved by installing a single license on the primary cluster, which will then distribute license leases to secondary clusters.
All excess license capacity on secondary clusters will contribute to a global pool of licenses maintained by the primary cluster.
It is possible to protect the Red Hat OpenShift Virtual Machine with Kasten! As we know, OpenShift Virtualization is included in OCP and allows the creation and execution of Virtual Machine workloads alongside container workloads.
É importante entender e comunicar aos clientes as diferenças entre as tecnologias de microchips FPGA e ASIC.
A tecnologia “Field-Programmable Gate Array” (FPGA) permite que um circuito integrado, ou chipset, possa ser reprogramado logicamente a qualquer momento, caso necessário. Por isso, a tecnologia FPGA permite correções em funções lógicas relacionadas a bugs, brechas de segurança ou mesmo a implementação e disponibilização de novas funcionalidades e capacidades em um hardware já produzido.
Já a tecnologia “Application-Specific Integrated Circuit” (ASIC) está relacionada com chipsets de uso dedicado e que não podem ser reprogramados depois de produzidos. Os circuitos lógicos são definitavamente “gravados” no silício. Assim, a correção de um bug ou uma brecha de segurança relacionada com o projeto lógico do chipset não pode ser realizada após ele ser produzido (correção ou upgrade em campo). Portanto, o risco financeiro é maior se a solução não estiver devidamente validada e madura.
Porque os fabricantes optam pelo uso de ASICs em seus equipamentos?
Basicamente, devido ao baixo custo de produção dos chipsets em larga escala, que é bem menor se comparado com o custo de produção da tecnologia FPGA em altas quantidades. Por outro lado, na tecnologia ASIC, os custos de projeto chamados Non-Recurring Engineering (NRE costs) são elevados.
A tecnologia FPGA geralmente é utilizada nas fases de desenvolvimento, prototipagem, testes e release inicial dos produtos, permitindo correções e ajustes da solução, caso seja necessário.
Uma vez que a solução está madura e validada suficientemente, os produtos passam a utilizar ASICS, que são produzidos em larga escala a partir das programações lógicas finais de um FPGA. Os custos de conversão de um projeto FPGA para chipsets ASIC são relativamente menores que os custos NRE.
No inicio da minha carreira, a programação dos FPGAs era realizada através de desenhos lógicos. Atualmente, a programação é realizada através de uma linguagem chamada “Hardware Description Language” (HDL).
Assim, não é correto informar que a estrutura lógica de um ASIC possa ser reprogramada. Inclusive, temos visto casos recentes da necessidade de substituição completa de appliances devido a brechas de seguranças relacionadas a hardware/ASICs, e que não podem ser corrigidas em campo.
Alguns dos principais fabricantes de FPGAs são: Intel (Altera), AMD (Xilinx), Achronix, Altium, Lattice e Microchip.
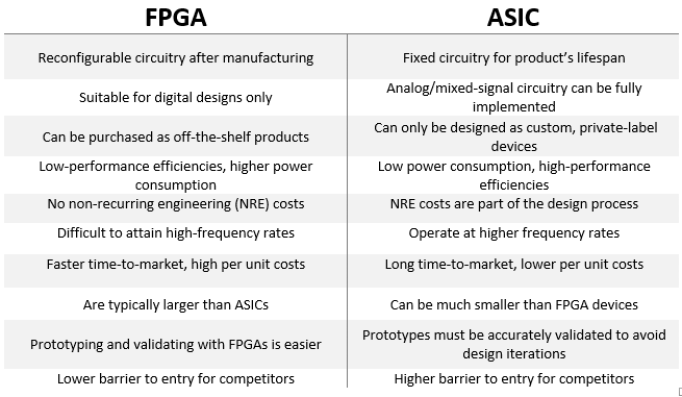
Na figura há um resumo comparativo entre as tecnologias.
The ransomware attacks continue to impact governments and cities, taking down IT systems and disrupting online services. Recently, the Royal actors perpetrated attacks in Dallas, the city of Augusta, and Georgia in the USA.
The Dallas city said it might take weeks to recover from the incident and faced backlash from police officers, firefighters, and emergency service workers.
This ransomware also has frequently threatened critical infrastructure sectors, such as manufacturing and healthcare. So, the impact of it extends beyond just financial losses. Since 2022, it impacted at least 157 organizations, as reported by Unit 42 from Palo Alto.
The CISA (Cybersecurity and Infrastructure Security Agency) released and Cybersecurity Advisory under the alert code AA23-061A:
In Brazil, the CITR (Center for Prevention, Treatment and Response to Government Cybernetic Incidents) issued an alert about this threat earlier this year.
Royal ransomware is associated with Windows systems but expanded its arsenal by developing a variant to impact Linux and ESXi environments.
As well as other attacks, Royal actors gain initial access to victim networks in several ways, including:
Phishing emails: victims have unknowingly installed malware that delivers Royal ransomware after receiving phishing emails containing malicious PDF documents and malvertising.
RDP (Remote Desktop Protocol) access.
Exploit using public-facing applications.
Once Royal actors gain access to the network, they communicate with command-and-control infrastructure and download multiple tools.
Royal operators repurpose legitimate Windows software. It is a “Living off the land” method. It consists of using existing tools & features installed or existing in the target environment, drastically reducing the footprint and evading detection.
Lateral movement is also exploited in this attack. The actors often use Remote Desktop Protocol (RDP) to move laterally across the network. The PsExec,a Microsoft Sysinternals tool, has also been used to aid lateral movement.
2) Deployment of multifactor authentication (MFA).
3)Keep all operating systems, software, and firmware up to date.
4) Restriction of lateral movement. Networks must be designed not only to attempt to keep attackers out, but also to make their lives as difficult as possible once they do gain an internal foothold. This reference document describes the RDP, PsExec and other communications techniques, and defensive considerations are presented for each one:
The networks must be segmented/micro-segmented with solid barriers between different logical groupings of resources.
5) Deploy a networking monitoring tool that logs and reports all network traffic, including lateral movement activity on a network. Endpoint detection and response (EDR) tools also help to detect lateral connections.
6) Disable all unused logical ports on the network.
7) Install, regularly update, and enable accurate time detection for antivirus and EDRon all hosts.
8) Review domain controllers, servers, workstations, and active directoriesfor new or unrecognized accounts.
9) Audit user accountswith administrative privileges.
10) Disable command-line and scripting activities and permission.
The last frontier of business protection
11) Maintain offline backups and regularly maintain automatic backup and restoration tests/validation.
12) Ensure all backup data is encrypted, immutableand it covers the entire organization’s data infrastructure.
13) Deploy, maintain, test, and continuously update a Disaster Recovery and Business Continuity plan.
Decryption tools for free
The “No More Ransom” website is an initiative by the National High Tech Crime Unit of the Netherlands’ police, Europol’s European Cybercrime Centre, Kaspersky, and McAfee to help ransomware victims retrieve their encrypted data without paying the criminals.
The decryption tools on the “No More Ransom” website have helped more than six million people recover their files for free.
There are 121 free tools able to decrypt 151 ransomware families. The initiative unites 170 partners from the public and private sectors. The portal is available in 37 languages, including Portuguese and Spanish.
Remember: these tools do not replace the need for a secure and consistent backup strategy or the protection measures described above.
Decryption can sometimes take several days, directly impacting business continuity. The best way to mitigate these impacts is through a consistent business continuity, backup, and disaster recovery plan.
Ansible Execution Environments (EE) may raise some questions among Ansible Automation Platform users.
EEs were introduced in the 2.0 release of the Ansible Automation Platform as a first initiative to separate the control and execution planes of automation and provide better scalability for both developers and administrators With the release of Ansible Automation Platform 2.1, this strategy was fueled with Automation Mesh. Both are intrinsically related and provide the ability to automate in a distributed, scalable way and across different types of infrastructures and clouds
Motivation: Python libraries and dependencies
Ansible is a tool written in Python and uses YAML declarative language to describe the desired state of devices and configurations.
However, Python-based applications have an essential characteristic: they usually need packages and modules not included in Python standard library.
Sometimes, applications need a specific library version with a particular fixed bug or written using a distinctive feature or integration.
As an illustration, the table below shows the various versions of Python associated with control and management nodes for specific Ansible core versions.
Ansible was born as a monolithic architecture; growing the ability to run automation meant that the entire automation cluster needed to be scaled out as needed.
It has a limited ability to run automation to a single cluster. Thus, architectural options were limited for architects. It was often necessary to deploy multiple Ansible clusters or isolated nodes to expand automation capacity across different regions or networks, making it sensitive to network latency and connection interruptions.
To overcome these limitations, new capabilities were added, such as using virtual environments (venv) from Python and implementing “isolated nodes.”
Virtual Environments and Isolated Nodes
Virtual environments (vevs) are independent directory trees within Ansible Tower: a folder containing all the executables and dependencies needed for a specific version of Python.
IT allowed you to add or update modules to Ansible and, per your requirements, to run specific playbooks. One application could have its virtual environment with Python version 2.7 installed, while another application has another virtual environment associated with it with version 3.5.
Updating a library for a particular application would not affect the other applications associated with other venvs – as they were isolated by independent directories in Tower.
Another function created over time was the “Isolated Node” figure, aiming to bring more architecture options, especially when links were interconnecting to managed devices hosted in remote locations or the segmentation of networks with firewalls.
In these scenarios, it was possible to implement an isolated node. It was nothing more than an Ansible Tower node with a much smaller software package capable of running playbooks locally.
Periodically, the Ansible Tower master node communicated via SSH with the isolated nodes to synchronize configurations and update automation jobs.
Evolution to Automation Mesh
Still, implementing and maintaining a distributed architecture presented many challenges.
With virtual environments, it was necessary to have an internal administration team maintaining dozens of virtual environments (virtual environments) for various types of groups that consume automation.
Some teams might need different versions of Ansible; network teams require other automation content and dependencies to automate their devices, and developers need to create their test environments.
The implementation of isolated nodes also presented its challenges. Communication between the Ansible Tower master and the isolated nodes was unidirectional. There was still a sensitivity to communication latency, and in many cases, it was necessary to implement intermediate nodes such as SSH proxies or jump nodes to mitigate it.
Automation Mesh was made available in Ansible Automatiom Platform 2.1 to work around these limitations.
It makes use of an upstream community project called receiver.
The receiver creates an overlay network over the existing network. A receiver application will run as a daemon on each node associated with this overlay network.
Once connected, these nodes form a mesh-like network capable of providing datagram (as in UDP) and stream services (as in TCP) to the applications hosted on them.
With the ability to connect remotely, reliably, and overlay, it was possible to evolve to a truly distributed architecture in Ansible. The control plane started to be segregated from the execution plan, allowing to deliver and execute the automation closer to the devices and in a more straightforward, replicable, and modular way.
In this new distributed architecture, driven by Automation Mesh, there are now four types of nodes:
Control Plane Nodes: accessed by users through WebUI and API. Execution features are disabled on these nodes.
Execution Nodes: these are where the Ansible playbooks will run. This node will run an execution environment that will run the Ansible playbooks according to the needs and requirements of the applications and elements being automated.
Hop Nodes: optional nodes used to interconnect and allow communication between control and execution nodes.
Hybrid Nodes: capable of simultaneously executing and implementing automation and controller functions.
Execution Environments and Execution Nodes
Execution Environments, formerly called Ansible Engine, allow overcoming many of the operational challenges that existed with virtual environments and isolated nodes
Unlike virtual environments, executions environments are container images. It allows the use of a custom image containing what is needed to run the automation jobs a managed node needs.
An image of an EE container contains the following components:
RHEL UBI 8 as OS;
The desired version of Ansible Core;
Python version 3.8 and its dependencies;
Bindep and its dependencies;
Any Ansible collection and its specific dependencies.
So we moved on to a customizable and standardized automation package that contains all the components needed to deliver automation, including dependencies and a version of Ansible. A Red Hat Linux image supports all of them.
The executions nodes then run the execution environment associated with them to deliver automation to managed devices.
And the execution nodes with their associated execution environments can be deployed in different locations and closer to the devices, reducing latency and applying automation autonomously.
In addition, an execution environment scales separately and as needed, delivering greater granularity in resource allocation and simpler scale-out.
The figure below shows how it is possible to associate an execution environment with a job template in Ansible Automation Controller. In this example, we have a hybrid node
The following EEs are preconfigured and available natively in AAP:
Minimal (ee-minimal-rhel8): contains Ansible-2.11 built on top of UBI8 and python-3.8. This image does not contain any Collections. We can use it as the base image to create different executions environments with your custom collections or the certified content collections available on the Ansible Automation Hub.
Supported (ee-supported-rhel8): this is the default image available with the automation controller. It is built on top of the minimal image and contains Ansible content collections supported by Red Hat.
Ansible 2.9 (ee-29-rhel8): Ansible-2.9 and all its required dependencies. This image is ideal for anyone planning to migrate to Ansible Automation Platform 1.2. for Ansible Automation Platform 2.0.
Building an Execution Environment
Ansible Builder is a tool that automates the construction process of execution environments. It creates images of execution environments using dependency information defined by users and the various collections of Ansible content.
It uses a directory that acts as the build context for the container image, containing the container file and any other files added to the execution environment image.
By default, Ansible Builder´s runtime container is Podman, but Docker is also supported.
After creating an execution environment image, we can send it to a “container registry” for users to consume.
One of the main options is to make the image available to the Private Automation Hub.
Step by step to build an EE for integration with ServiceNow
In this example, we are using a hybrid node. However, nothing prevents it from being used in the Mesh context and associated with an execution node.
The first step is to install the Ansible builder.
You can install Ansible Builder using Red Hat Subscription Management to register and attach to your Red Hat Ansible Automation Platform subscription. Just run the following command:
$ dnf install ansible-builder
Once installed, we can explore the various commands and options:
ansible-builder --help
Analyzing the options for the “build” subcommand, we have:
ansible-builder build --help
The “build” subcommand creates an execution environment with environments based on a file with definitions. It fills in the build context and then invokes Podman or Docker to build the execution environment image.
Let’s check out how to populate the builder specification file and create an execution environment.
First, let’s create a “project_directory” directory, where all the files needed to build the image will be stored.
mkdir project_directory && cd project_directory
Let’s populate the “execution-environemt.yml” file with the following content:
cat <<EOT >> execution-environment.yml
—
version: 1
dependencies:
galaxy: requirements.yml
python: requirements.txt
system: bindep.txt
additional_build_steps:
prepend: |
RUN whoami
RUN cat /etc/os-release
append:
– RUN echo This is a post-install command!
– RUN ls -la /etc
EOT
In this file, we specify the dependencies related to the Galaxy collection in the “requirements.yml” file. We also specify a Python file called “requirements.txt” that will contain the pip dependencies needed to run the content. Finally, we define a “bindep.txt” file, which will hold the necessary rpm installations.
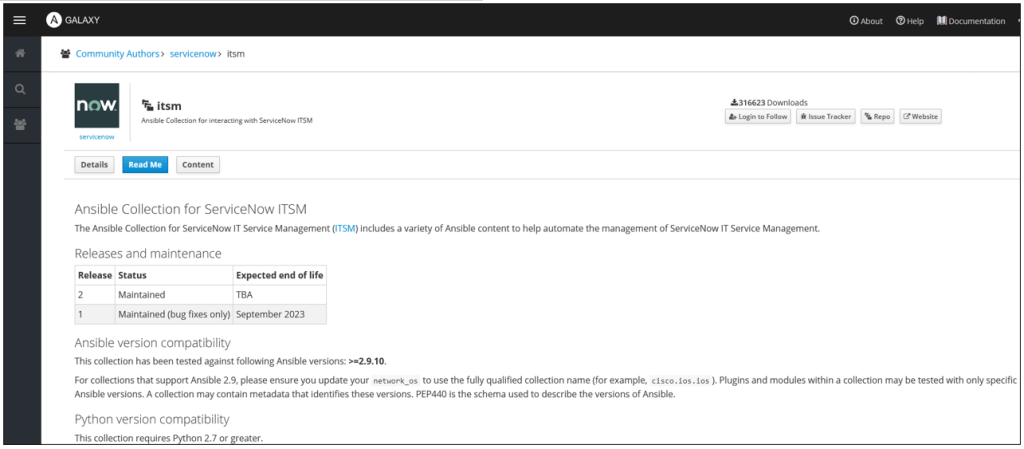
Let’s then create the “requirements.yml” file. Let’s add the servicenow.itsm collection and a collection called ansible.utils to it
The ServiceNow ITSM collection enables faster workflow creation based on ServiceNow ITSM. It is possible to automate ServiceNow service requests, including reporting the results of changes and all related information. Start a playbook to resolve common requests and reduce routine and repetitive operational tasks.
Another possibility is the automation of incident handling. Automatic incident ticket updates help meet audit requirements.
It is also possible to simplify the opening, treatment, and resolution of items within the IT service management workflow and, at the same time, keep ServiceNow’s CMDB (Configuration Management Database) updated with user, team, and asset information.
Through the specification files “execution-environment.yml” and “requirements.yml”, we guarantee that ansible-builder will download both collections while creating the execution environment.
Also, the builder will consider all dependencies when creating the image.
cat <<EOT >> requirements.yml
—
collections:
– name: servicenow.itsm
– name: ansible.utils
EOT
Now let’s create the “requirements.txt” file. This file will contain the Python requirements we want to install via pip; they differ from those present in the individual collections specified in the “requirements.yml” file.
cat <<EOT >> requirements.txt
gcp-cli
ncclient
netaddr
paramiko
EOT
Finally, let’s create the “bindep.txt” file. This file contains the rpm requirements we want to install via dnf.
By logging in, we can see that the “custom-ee” has been published in the Private Automation Hub. Any user in the organization will be able to download this custom EE to run automations associated with ServiceNow.
I hope this post was helpful and may have helped to bring more details about the concept and use of Execution Environments in Ansible Automation Platform.
Os Execution Environments (EE) vem gerando algumas dúvidas entre os usuários do Ansible Automation Platform.
Os EEs foram introduzidos no release 2.0 do Ansible Automation Platform como um primeiro passo para separar o plano de controle do plano de execução da automação. E, com isso, oferecer melhor escalabilidade e portabilidade para os times de desenvolvimento e operação.
Como a disponibilização do Ansible Automatiom Platform 2.1, esta estratégia foi complementada através do Automation Mesh. Ambos estão intrinsecamente relacionados e proporcionam a capacidade de automatizar de forma distribuída, escalável e entre diferentes tipos de infraestruturas e nuvens.
Motivação: bibliotecas e dependências do Python
O Ansible é uma ferramenta escrita em Python e usa a liguagem declarativa YAML para descrever o estado desejado dos dispositivos e das configurações.
No entanto, as aplicações baseadas em Python possuem uma característica importante: geralmente elas necesitam de pacotes e módulos que não fazem parte da biblioteca padrão do Phyton.
Algumas vezes, as aplicações necessitam de uma versão específica de uma biblioteca para que um “bug” específico seja corrigido ou para que possam ser escritas utilizando determinadas capacidades e funcionalidades.
Como ilustração, a tabela abaixo mostra as várias versões obrigatórias do Python que devem ser instaladas nos nós de controle e de gerenciamento para versões específicas do Ansible Core.
O Ansible nasceu com uma arquitetura monolítica; crescer a capacidade de execução da automação significava que todo o cluster precisava ser expandido proporcionalmente à necessidade.
Isso limitava a execução da automação a um único cluster. Logo, as opções de arquitetura eram limitadas. Frequentemente era preciso implementar vários clusters Ansible ou nós isolados para expandir a capacidade de automação entre regiões ou redes diferentes, tornando-o sensíveis à latência de rede e a interrupções de conexão.
Para tentar contornar estas limitações, foram acrescentadas novas capacidades no Ansible, como o uso de virtual environments (venvs ou virtualenvs) do Python e a implementação dos “isolated nodes”.
Virtual Environments e Isolated Nodes
Os virtual environments (virtualenvs) nada mais são que árvores de diretório independentes dentro do Ansible Tower; é criada uma pasta que contém todos os executáveis e dependências necessárias para uma versão específica do Python.
Com eles, era possível adicionar ou atualizar módulos ao Ansible conforme os requisitos para executar playbooks específicos. Uma aplicação poderia ter seu próprio ambiente virtual com a versão 2.7 do Phyton instalada, enquanto outra aplicação possuir outro ambiente virtual associado a ela com a versão 3.5.
Se fosse necessário atualizar uma biblioteca para uma certa aplicação, isso não afetaria as demais aplicações associadas a outros venvs – pois eles eram isolados por diretórios independentes no Tower.
Outra função criada ao longo do tempo foi a figura dos “isolated nodes” visando trazer mais opções de arquitetura, especialmente quando existiam links interligando os dispositivos gerenciados hospedados em localidades remotas ou a segmentação de redes com firewalls.
Nestes casos, era possível implementar um nó de automação isolado na localidade/site. Ele nada mais era um nó do Ansible Tower com um pacote de software bem menor e capaz de executar playbooks localmente.
Periodicamente, o Ansible Tower master node se comunicava via SSH com os isolated nodes para sincronizar configurações e atualizar jobs de automação.
Evolução para o Automation Mesh
Ainda assim, implementar e manter uma arquitetura distribuída apresentava uma série de desafios.
Com os virtual environments, era preciso ter uma equipe de administração interna mantendo dezenas de virtual environments (vevs) diferentes para várias tipos de equipes que consomem automação.
Algumas equipes podiam necessitar de versões diferentes do Ansible; ou precisavam de coleções específicas; equipes de rede exigiam diferentes conteúdos de automação e dependências para que pudessem automatizar seus dispositivos; e os desenvolvedores precisavam criar seus próprios ambientes para testes.
Mas a implementação e utilização dos isolated nodes também apresentava os seus desafios. A comunicação entre o Ansible Tower master e os isolated nodes era unidirecional. Ainda existia uma sensibilidade a latência de comunicação e em muitos casos era preciso implementar nós intermediários como proxies SSH ou jump nodes para mitigá-la.
Para contornar estas limitações, o Automation Mesh foi disponibilizado no Ansible Automatiom Platform 2.1.
Ele faz uso de um projeto de upstream da comunidade chamado receptor.
O receptor cria uma rede de overlay sobre a rede existente (underlay). Para cada nó associado a esta rede de overlay, haverá uma aplicação do receptor executada como um daemon.
Uma vez conectados, estes nós formam uma rede do tipo mesh capaz de fornecer serviços de datagrama (como no UDP) e de fluxo (como no TCP) para as aplicações hospedadas neles.
Com a capacidade de conexão remota, confiável e do tipo overlay, foi possível evoluir para uma arquitetura realmente distribuída no Ansible. O plano de controle passou a ser segregado do plano de execução, permitindo entregar e executar a automação mais próximo dos dispositivos e de uma forma mais simples, replicável e modular.
Nesta nova arquitetura distribuída, impulsionada pelo Automation Mesh, passaram a existir quatro tipos de nós:
Control Plane Nodes (nós do plano de controle): são pelos usuários através de WebUI e API. Os recursos de execução são desativados nesses nós.
Execution Nodes (nós de execução): é neles que os playbooks do Ansible serão realmente executados. Este nó executará um execution environment que, por sua vez, executará os Ansible playbooks de acordo com as necessidades e requisitos das aplicações e dos elementos que estão sendo automatizados.
Hop Nodes (nós de salto): são nós opcionais que podem ser usados para interconectar e permitir a comunicação entre nós de controle e nós de execução.
Hybrid Nodes (nós híbridos): são capazes de executar ao mesmo tempo funções do controlador de automação e também a execução de automação.
Execution Environments e Execution Nodes
Um Execution Environment, antes chamado de Ansible Engine, permite superar vários dos desafios operacionais que existiam com os virtual environments e com os isolated nodes.
Ao contrário dos virtual environments, os executions environments, execution environment são imagens de contêiner. Assim, passamos a utilizar uma imagem personalizada e contendo apenas o que é necessário para executar os jobs de automação necessários para os nós gerenciados.
Uma imagem de um container EE contém os seguintes componentes:
RHEL UBI 8 como sistema operacional;
A versão desejada do Ansible Core;
Versão do Python 3.8 e suas dependências;
Bindep e suas dependências;
Qualquer coleção do Ansible e suas dependências específicas.
Trata-se de um pacote de automação customizável, padronizado e que contém todos os componentes necessários para entregar automação, incluindo as dependências e a versão principal do Ansible. Tudo sobre uma imagem validada do Red Hat Linux.
Os executions nodes passam então a executar os execution environments (EEs).
O execution nodes com os execution environments associados a eles podem ser implementados em diferentes localidades ou nuvens, ficam mais próximos dos dispositivos gerenciados. Isso reduzindo a latência e possibilita aplicarmos a automação de forma autônoma e portável.
Além disso, eles podem ser escalados isoladamente e conforme a necessidade, entregando uma maior granularidade na alocação dos recursos e scale-out mais simples.
Na tela abaixo do Ansible Automation Controller, podemos ver como é possível associar um execution enviroment a um job template. Neste exemplo, temos um nó híbrido.
Os seguintes EEs são pré-configurados e estão disponíveis nativamente na plataforma:
Minimal (ee-minimal-rhel8): Contém Ansible-2.11 construído sobre UBI8 e python-3.8. Esta imagem não contém nenhuma Coleção. Podemos usar como a imagem base para criar executions environments adicionais com suas coleções personalizadas ou com as coleções de conteúdo certificado disponíveis no Ansible Automation Hub.
Suportado (ee-supported-rhel8): Esta é a imagem padrão disponível com o controlador de automação. Ela é construído sobre a imagem mínima e contém coleções de conteúdo Ansible suportadas pela Red Hat.
Ansible 2.9 (ee-29-rhel8): Contém o Ansible-2.9 e todas as dependências necessárias. Esta imagem é ideal para quem planeja migrar para do Ansible Automation Platform 1.2. para o Ansible Automation Platform 2.0.
Processo de criação de um Execution Environment
O Ansible Builder é uma ferramenta que automatiza o processo de construção de execution environments. Ele realiza a criação da imagem de um execution environment utilizando informações de dependência definidas pelos usuários e pelas várias coleções de conteúdo do Ansible.
Ele utiliza um diretório que atua como o contexto de compilação para a construção da imagem do contêiner, que possuirá o “containerfile”, juntamente com quaisquer outros arquivos que precisem ser adicionados à imagem do execution enviroment.
Por padrão, o container runtime utilizado pelo Ansible Builder é o Podman, mas o Docker também pode ser utilizado.
Depois de criar uma imagem do execution environment, podemos enviá-la a um “container registry” para que seja consumida pelos usuários.
Uma das principais opções é enviar a imagem para o Private Automation Hub.
Passo a passo de criação de um EE para integração com o ServiceNow
Neste exemplo, estamos utilizando um hydrid node. No entanto, nada impede que ele seja utilizado no conteto do Mesh e associado a um execution node.
O primeiro passo é a instalação do Ansible builder.
É possível instalar o Ansible Builder usando o Red Hat Subscription Management para registrar e anexar à sua assinatura do Red Hat Ansible Automation Platform. Basta executar o seguinte comando:
$ dnf instalar ansible-builder
Uma vez instalado, podemos explorar os vários comandos e opções:
ansible-builder –help
Analisando as opções para o subcomando “build”, temos:
ansible-builder build --help
O subcomando “build” é o responsável por criar um execution environment com ambientes com base em um arquivo com definições. Ele preenche o contexto da construção e, em seguida, invoca o Podman ou Docker para criar a imagem do execution environment.
Vamos verificar como popular o arquivo de especificação do builder e criar um execution environment.
Primeiro, vamos criar um diretório chamado “project_directory” onde todos os arquivos necessários para criar a imagem serão armazenados.
mkdir project_directory && cd project_directory
Vamos popular o arquivo “execution-environemt.yml” com os seguinte conteúdo:
cat <<EOT >> execution-environment.yml
—
version: 1
dependencies:
galaxy: requirements.yml
python: requirements.txt
system: bindep.txt
additional_build_steps:
prepend: |
RUN whoami
RUN cat /etc/os-release
append:
– RUN echo This is a post-install command!
– RUN ls -la /etc
EOT
Neste arquivo especificando as depêndencias relacionadas com a coleção Galaxy no arquivo “requirements.yml”; também estamos especificando um arquivo python chamado “requirements.txt” que conterá as dependências de pip necessárias para a execução do conteúdo; e por fim, estamos especificando um arquivo “bindep.txt”, que manterá as instalações rpm necessárias.
Vamos então criar o arquivo “requirements.yml”. Vamos adicionar nele a coleção servicenow.itsm e uma coleção chamada ansible.utils.
A coleção ServiceNow ITSM permite a criação de workflows mais rapidamente com base no ServiceNow ITSM. É possível automatizar as solicitações de serviço ServiceNow, incluindo relatórios dos resultados de alterações e todas as informações relacionadas elas. Basta iniciar um playbook para resolver solicitações comuns e reduzir tarefas operacionais rotineiras e repetitivas.
Outra possibilidade é a automação do tratamento de incidentes. Atualizações automáticas de tíquetes de incidentes ajudam a atender requisitos de auditoria.
Também é possível simplificar a abertura, tratamento e resolução de itens dentro do workflow de gerenciamento dos serviços de TI e ao mesmo tempo manter o CMDB (Configuration Management Database) do ServiceNow atualizado com informações de usuários, equipes e ativos.
Por meio do arquivo de especificação “execution-environment.yml” e do arquivo “requirements.yml”, garantimos que o ansible-builder fará o download das duas coleções durante a criação do execution environment. Além disso, o builder levará em conta todas as dependêcias na criação da imagem
cat <<EOT >> requirements.yml
—
collections:
– name: servicenow.itsm
– name: ansible.utils
EOT
Agora vamos criar o arquivo “requirements.txt”. Este arquivo conterá os requisitos do Python que desejamosinstalar via pip; eles são diferentes dos requisitos presentes nas coleções individuais especificadas no arquivo “requirements.yml”.
cat <<EOT >> requirements.txt
gcp-cli
ncclient
netaddr
paramiko
EOT
Por fim, vamos criar o arquivo “bindep.txt”. Este arquivo contém os requisitos de rpm que desejamos instalar via dnf.
Realizando o login, podemos ver que o “custom-ee” foi publicado no Private Automation Hub. Qualquer usuário da organização poderá realizar o download deste EE personalizado para realizar automações associadas com o ServiceNow.
Espero que este post tenha sido útil e que possa ter ajudado a trazer mais detalhes sobre o conceito e uso dos Execution Environments (EEs) no Ansible Automation Platform.
This survey included 752 qualified software development and IT professionals in charge of Kubernetes at companies with 1,000 or more employees, covering various roles, industries, regions, and job levels.
Deploying architectures in multiple public cloud vendors or a mix of public and private clouds has become the dominant strategy. More than three-quarters of those surveyed (76%) already use multiple clouds.
The tendency is also to deploy Kubernetes environments in a multi-cloud strategy. More than half (53%) plan to add or increase capacity across multiple cloud vendors compared to (37%) expanding on-premises and (36%) expanding in a single public cloud.
According to the report, this multi-cloud strategy is driven by these main motivations: (53%) reduce vendor dependency; (45%) manage costs; (42%) expand DR and backup capabilities.
When we look at the Kubernetes offerings in use, the results support the numbers regarding the shift to a multi-cloud strategy. While the offerings from Amazon and Microsoft remain widely used, they are no longer gaining ground.
On the other side, popular Kubernetes distributions, capable of running in public clouds, on-premises, and at the edge, are seeing increased usage.
It includes, in order of adoption magnitude: Red Hat OpenShift, VMware Tanzu, and Rancher.
The survey also showed that, when choosing a Kubernetes distribution, stakeholders also prioritize ease of use solutions, qualified support and services provided by the vendor, vendor maturity/reputation, and avoiding vendor/cloud lock-in.
I believe these results also align with the company’s tendency to move away from DIY Kubernetes. Companies prefer to let vendors handle assembling and keeping their Kubernetes environments support.
I believe that the Kubernetes market has a lot to evolve. Perhaps, soon, Kubernetes will be just another abstraction within the stack of application development tools.
With the advent of AI, which is already being incorporated into software development processes, many of the integration and operational difficulties that exist today in the K8s will have to be overcome in a user-friendly way.
We are already witnessing the incorporation of AI into solutions aimed at infrastructure automation, such as the Wisdom project, which infuses AI models into Ansible to make playbook development more user-friendly.
It remains for us to follow all these developments!
The developer experience (DevX) is in evidence for many reasons.
DevX aims to measure how developers interact with the resources needed to do their job in the best possible way: building, maintaining, testing, deploying, and analyzing software.
According to a study conducted by Forrester Consulting in 2022 with 650 decision-makers, most otf them recognize that the developer experience can affect the execution of the business strategy, the competitiveness of the organization, and the satisfaction of the customers.
Furthermore, if the quality of experience of software development teams is not adequate, it will directly affect the motivation, productivity, and the deliverable quality of people working on a specific project.
Motivation. When tools facilitate work, engagement is more significant. It certainly helps to retain talent and reduce turnover in teams.
Productivity. Most developers like to be involved in more complex or challenging work and activities. A development experience that allows more straightforward tasks to be completed efficiently will lead to more agile and value-added development cycles.
Quality. When development teams have access to tools that help with documentation, code debugging, and detailed testing, the resulting code will have fewer bugs, greater security, better performance, and better stability
Currently, there are many metrics used to measure the developer experience (DevX), and they help to identify areas where improvements can be applied, in addition to enabling the monitoring of the evolution of the experience over time
Some examples of metrics are:
Developer Satisfaction. This metric measures developers’ satisfaction with the development tools, processes, and environment. Developer satisfaction is measured using, for example, surveys or feedback.
Lead Time. This metric measures the time required from the start of the project to the deployment of new features or bug fixes in the production environment. A shorter time indicates that the development process is efficient and streamlined.
Code Quality. Code quality is vital as it affects the overall quality of the software. High-quality code is easy to read, maintain, and test. Using tools that control code reviews and perform automated tests will help improve code quality.
Many other metrics can be associated with DevX. The important thing is to understand that the starting point for improving DevX is using metrics.
In addition to metrics, a developer platform plays a crucial role in improving DevX.
An Internal Developer Platform (IDP) is formed by the tools used by developers, such as:
Integrated Development Environments (IDE) like VSCode, JetBrains, etc.
Version Control Systems (VCS) like GitHub, GitLab, etc.
Resources like containers, databases, storage, compute, transit, etc.
Kubernetes orchestrator
Observability tools
Security tools
CI tools like CircleCI, GitHub Actions, and Bitbucket
GitOps tools and CD controllers, like Argo CD
Infrastructure as Code tools, like Ansible and Terraform
By definition, an Internal Developer Portal is a single portal for developers capable of bringing together all the tools and technologies available and used in software development.
In addition to the examples of platform tools described above, an Internal Developer Portal also includes documentation, tutorials, sample code, API documentation, and other resources that help developers understand how to use a product or service.
Therefore, the quality of a developer portal can have a significant impact on DevX.
A well-designed and comprehensive developer portal can make it easier for developers to find the necessary tools and information and troubleshoot issues. It will lead to a more positive experience.
However, a poorly designed or incomplete portal can lead to frustration and wasted time. It can negatively affect DevX and hamper developer productivity.
Gartner’s “Innovation Insight for Internal Developer Portals” report summarizes well the integration capabilities that an Internal Developer Portal must have, as shown in the figure below:
For all these reasons, there is a movement in the market to define frameworks and tools capable of building portals for developers.
One of the main player in this area is Backstage, an open-source platform.
Backstage was an internal project launched in 2016 to build Spotify’s internal developer portal, and it reduced the onboarding time for Spotify’s developers by 55 percent.
The project began as an incubation in the Cloud Native Computing Foundation Sandbox in September 2020, moved from the Sandbox to the official incubation stage in March 2022, and the Official GA was released on March 2022.
Backstage unifies all your infrastructure tooling, services, and documentation to create a streamlined development environment from end to end.
Backstage is not a finished product. Instead, Backstage is a collection of tools and libraries used to create your Developer Portal.
The Backstage architecture consists of 03 layers, as shown in the figure below:
Backstage Core: the layer the Backstage team maintains and releases as open source.
App: basically, this is the layer that will be made available for developers to use, that is, the portal itself. The app ties together core functionality with additional plugins.
Plugins: additional functionality to make your Backstage app useful for your company. Plugins can be specific to a company or open-sourced and reusable. Backstage is a single-page application composed of a set of plugins. Even basic functionality is abstracted as a plugin and included in a Catalog
The Backstage open-source community is very active, and the ecosystem has about 180 ready-made plugins like:
Agile management, like Jira
Source code management, like GitHub Pull Requests, GitHub Insights
Quality, like SonarQube, Google Lighthouse
Discovery, like API Docs, Harbor, Home, Tech Radar, TODO, Cost Insights
CI/CD, like ArgoCD, Azure Pipelines, CircleCI, GitHub Actions, GitLab, Jenkins, Travis CI
Monitoring, like Datadog, Grafana, Kafka, New Relic, PagerDuty, Prometheus
Security, like Snyk, Security Insights
Infrastructure, like AWS CloudFormation, AWS Lambda
Additionally, Backstage offers five core functionalities: a software catalog, software templates, a documentation generator, a Kubernetes cluster visualizer, and cross-ecosystem search capabilities
The Service Catalog is the essential element. Its objective is to map all software assets in your organization, including websites, APIs, libraries, and resources, in a centralized directory.
In the Service Catalog the developer should be able to find all relevant information about the organization’s services: owner, lifecycle, runtime, version, slack channel, last deployment link, and more.
Backstage’s Service Catalog is a unified metadata source and ownership information for all team software. You can track your services, apps, pipelines, and more in one unified view. The catalog uses metadata YAML files stored with the application code.
As this post is just an introduction to the subject, For more information about Backstage core functionalities, I recommend the following Free Linux Foundation Training: Linux Foundation LFS142 – Introduction to Backstage:
Backstage is being adopted as a standard framework in industry by some DevOps platforms such as VMware Tanzu and Red Hat Openshift.
The VMware Tanzu Application Platform is natively based on Backstage. And it even adds additional functionality that was built on top of Backstage’s flexible plugin architecture.
Workload visibility: Dynamic view of the application after deployment, including detailed information about objects at each level of the resource tree, such as Knative Service, Kubernetes Deployment, ReplicaSet, Pods, etc., with one-click access to the app via Knative Route.
App Live View: Graphical display of the app’s health status based on the Spring Boot app’s Actuator mechanism, real-time monitoring of CPU/memory, details of recent HTTP requests, dynamic adjustment of log levels, and more.
App Accelerator: A predefined project template made available to the development team. It automatically generates the overall project directory structure and essential configuration files to meet enterprise technology standards and architecture specifications, making it easy for the project team to get started quickly.
Supply chain visibility: Graphical display of the supply chain execution path and status, allowing further viewing of the execution details of each step.
The Red Hat OpenShift is also moving towards integration with Backstage. Last year Red Hat joined the Backstage.io community.
As a first step, Red Hat is making available a Helm chart that gets Backstage up and running in both an OpenShift deployment and a vanilla K8s environment. What starts with a small step is the beginning of bringing Backstage into the OpenShift ecosystem and on a collaborative path to an enterprise-supported developer platform for OpenShift developers.
The Veeam Kasten version 5.5.9 was released today! The new features are:
Import applications with block mode exports in clusters that do not support block mode exports
By default, K10 restores Kubernetes resources as they exist in the restore point. However, there are times when the restore target does not match the environment of the backup. For these situations, K10 allows Kubernetes resource artifacts to be transformed on restore.
It applies to changing the storage class configured for the application in the source cluster to another storage class available in the target cluster. This new feature allows migrating applications with block mode export to a cluster that does not support block mode.
A block mode export is available only with vSphere storage integration. A block mode export accesses the content of the disk snapshot at the block level using infrastructure-specific APIs.
This new feature allows to migrate applications with block mode export in the following infra/storage providers:
AWS: ebs.csi.aws.com, kubernetes.io/aws-ebs
Google Cloud: pd.csi.storage.gke.io, kubernetes.io/gce-pd
At this release, it is a feature that requires vSphere 7.0.3+ and a Veeam Backup server version V12. It is based on Instant First Class Disk (FCD) Recovery feature from Veeam Backup & Replication v12. Tanzu is not supported at this moment.
In this case, a vSphere cluster is hosting the Kubernetes cluster. K10 asks the Veeam Backup server to make an Instant First Class Disk (FCD) Recovery and then creates Persistent Volumes that use those FCDs.
The vPower architecture is the same: FCDs exist in a vPower NFS datastore created by the Veeam Backup server. Once the Instant Recovery has been completed, the application will run using these resources.
To conclude the operation, you must migrate FCDs to the production environment or stop publishing them. Veeam Backup & Replication uses the Quick Migration mechanism to migrate the disks – with no interruption in the service.
A PersistentVolumeClaim (PVC) is a request for storage by a user. It is similar to a Pod. Pods consume node resources, and PVCs consume Persistent Volume resources. Pods can request specific levels of resources (CPU and Memory).
Claims can request specific size and access modes – they can be mounted ReadWriteOnce, ReadOnlyMany, or ReadWriteMany, see AccessModes.
This feature allows, during restores, to rename PVCs depending on how the workload has been configured.
It is an additional capability added to the “K10´S Restoring Applications” options, which delivery extra flexibility.